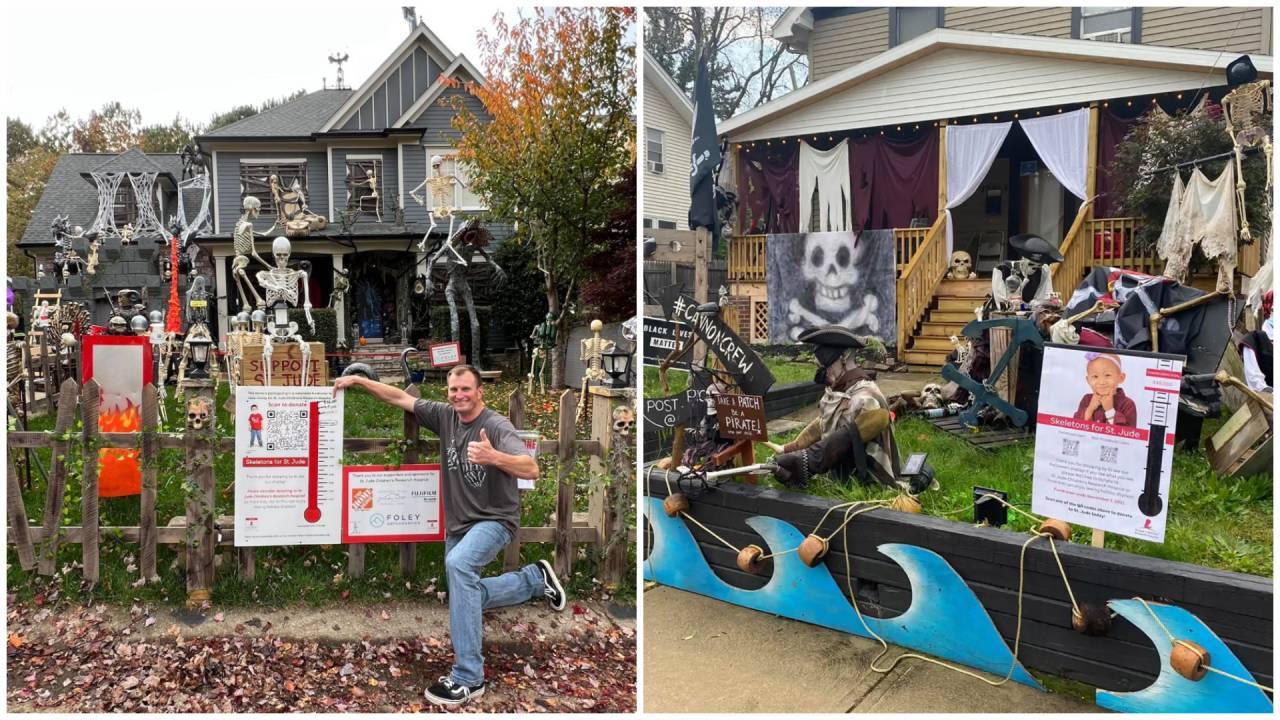
Scaling a hyper-local fundraising event from a $1.1 million single-home anomaly to a $2 million 625-home distributed network requires abandoning viral luck in favor of standardized replication. When Jeff Robertson’s 2020 Halloween display generated $1.1 million for St. Jude Children’s Research Hospital, it operated on concentrated scarcity—one physical location capturing maximum digital and foot traffic during a pandemic-induced entertainment vacuum. Expanding that model across 625 residential nodes to hit $2 million in 2026 shifts the operational mechanics entirely. Instead of maximizing yield per square foot at a flagship site, the campaign must optimize average revenue per participating household while managing severe dilution in per-node capital efficiency.
The Dilution Math of Distributed Fundraising
The core strategic tension in the 2020-to-2026 trajectory lies in the inverse relationship between node count and per-node yield. In 2020, a single display produced $1,100,000 in gross donations. In 2026, a target of $2,000,000 distributed across 625 homes requires an average yield of just $3,200 per household.
This 99.7% drop in required per-node output reveals the structural reality of scaling grassroots initiatives. A single flagship event relies on extreme production value, intense localized PR, and a frictionless bottleneck where every donor funnels through one physical or digital point of sale. Replicating that production value 625 times is economically impossible for amateur participants. The campaign shifts from a High-Intensity Capital Model to a Low-Intensity Participation Model.
To understand why total revenue increases by only 81.8% while physical footprint expands by 62,400%, one must examine the three mechanics governing distributed fundraising:
- Attention Fragmentation: Media outlets cover a $1.1 million outlier because of the extreme concentration of capital in a single suburban yard. Six hundred twenty-five smaller displays scatter local press coverage, forcing each homeowner to act as their own primary acquisition channel.
- Donor Cannibalization: In a concentrated metropolitan area, adding nodes does not linearly expand the total addressable donor pool. Neighbors who previously drove twenty minutes to donate $50 at a destination display now walk down the block and donate $10 at three different houses, flattening net new capital inflow.
- Variance in Execution: A single operator maintains 100% quality control. Across 625 independent operators, execution follows a steep power-law distribution. Roughly 10% to 15% of the homes—the super-nodes—will likely generate over half of the $2 million target, while the bottom quartile will struggle to clear $500.
The Four Pillars of Replication Infrastructure
Turning a one-off viral event into a multi-hundred-unit annual campaign requires building an invisible operating system beneath the festive exterior. Without centralized infrastructure, distributed campaigns collapse under administrative friction and donor skepticism.
1. Standardized Point-of-Sale Architecture
In physical-to-digital fundraising, friction kills conversion. Spectators walking past a Halloween display rarely carry cash, and manual URL entry drops conversion rates precipitously. Scaling to 625 locations demands uniform, tamper-proof signage featuring dynamic QR codes tied directly to a centralized St. Jude peer-to-peer fundraising ledger. By routing all 625 nodes through a unified backend, organizers eliminate the trust deficit. Donors do not have to verify whether a random neighbor is pocketing cash; the transaction clears directly through an institutional processor, while the campaign tracks attribution at the individual household level.
2. Tiered Production Kits
If participation requires spending $5,000 on animatronics and synchronized light controllers, the network will stall at twenty homes. Organizers must lower the barrier to entry by decoupling fundraising participation from extreme capital expenditure. A functional distributed network relies on tiered participation:
- Baseline Nodes: Standard yard signs, basic lighting, and official QR code placards. Low cost, high volume, serving primarily as brand impressions across neighborhoods.
- Anchor Nodes: High-budget, destination displays that draw regional traffic and anchor local media segments.
- Digital-Only Nodes: Participants who cannot build physical displays due to HOA restrictions or apartment living, utilizing the campaign's branding to run parallel social media drives.
3. Gamified Leaderboard Mechanics
Human behavior in peer-to-peer networks responds predictably to public status and local competition. Publishing real-time, node-level fundraising totals transforms passive decorators into active fundraisers. When a homeowner sees their display sitting at $2,400 while a neighbor three streets over sits at $3,100, social pressure triggers direct solicitation—texting family members, posting to neighborhood apps, and engaging local employers for matching gifts. The leaderboard shifts the burden of donor acquisition from the central organizer to the individual node operators.
4. Institutional Brand Shielding
Association with a tier-one medical institution like St. Jude provides immediate institutional credibility, neutralizing the primary objection in grassroots charity: fraud anxiety. The institutional partner supplies tax-deductible receipts, compliance oversight, and national brand equity. In exchange, the decentralized network provides the charity with zero-cost customer acquisition, capturing thousands of micro-donors who would never respond to traditional direct-mail or digital ad campaigns.
Macroeconomic Tail-Winds vs. Structural Headwinds
Evaluating the 2020 baseline against the 2026 target requires accounting for severe shifts in the macroeconomic environment. The 2020 campaign benefited from an artificial monopoly on consumer attention. With movie theaters, concerts, and indoor gatherings shut down, outdoor drive-by displays became primary entertainment options. Disposable income was temporarily buoyed by stimulus injections and reduced travel spending, creating an anomalous spike in charitable impulse giving.
The 2026 operating environment introduces three structural headwinds that the 625-home network must overcome:
- Inflationary Squeeze on Micro-Donors: Between 2020 and 2026, cumulative inflation eroded real discretionary income for middle-class households—the exact demographic strolling through suburban neighborhoods on October evenings. A spectator who casually dropped $50 in 2020 now weighs that contribution against elevated grocery and utility costs, compressing average transaction size.
- Novelty Decay: The "drive-by charity display" format is no longer novel. Consumer habituation means novelty alone no longer drives viral sharing on social platforms. The 2026 network cannot rely on organic algorithmic boosts; it requires coordinated local press blitzes and hyper-targeted community outreach.
- Participant Burnout: Decorating a home to attract public foot traffic carries hidden operational costs: higher electricity bills, lawn damage, parking congestion, and liability concerns. Retaining 625 operators requires active community management, early supply chain fulfillment for signage, and post-event recognition to prevent annual churn from gutting the network.
Attribution Models and Conversion Economics
To hit $2,000,000 across 625 nodes, organizers must manage the campaign like a multi-location retail franchise rather than a community club. Every participating house functions as a seasonal storefront with specific unit economics.
If the average donation across the network is $35, the 625 homes must collectively process approximately 57,143 individual transactions. Divided evenly, that requires 91.4 transactions per household over the October operating window. Because distribution is never even, a realistic operational forecast looks markedly different:
- Top 50 Anchor Homes (8% of network): Average $15,000 per home = $750,000 (21,428 transactions).
- Middle 250 Active Homes (40% of network): Average $3,500 per home = $875,000 (25,000 transactions).
- Bottom 325 Baseline Homes (52% of network): Average $1,153 per home = $375,000 (10,715 transactions).
This tiered modeling exposes the critical vulnerability of the 2026 target. If recruitment stalls at 400 homes, or if the top 50 anchor displays fail to hit their $15,000 average, the $2 million goal collapses. The bottom half of the network provides vital geographic density—creating the illusion that the entire city is participating—but the top 8% carries the financial viability of the entire enterprise.
Operational Risks and Scaling Limitations
Expanding a physical network into residential neighborhoods introduces operational liabilities that scale non-linearly. What is tolerated as a charming quirk at one house becomes a municipal nuisance at 625 houses.
- Municipal and HOA Friction: High-performing displays generate traffic bottlenecks, blocked driveways, and noise complaints. As the footprint expands to hundreds of homes, local municipalities and Homeowners Associations inevitably intervene, enforcing permit requirements, decibel limits, or outright bans on commercial-style signage.
- Attribution Leakage: When 625 displays promote a single overarching campaign, donors frequently bypass the individual house's QR code and donate directly to the main St. Jude portal later that evening. While the charity still receives the funds, this leakage distorts node-level performance data, discouraging homeowners whose physical foot traffic fails to register on their personal leaderboards.
- Logistics Bottlenecks: Shipping physical kits, yard signs, and lighting elements to 625 distinct addresses requires warehousing, inventory tracking, and dead-simple assembly instructions. A two-week delay in sign delivery eliminates half of the peak October fundraising window, permanently capping the yield of affected nodes.
The Strategic Play for Distributed Network Dominance
To ensure the 625-home network clears the $2 million threshold without collapsing under logistical weight, campaign leadership must stop treating all participating households equally and immediately institute a Bifurcated Resource Allocation Strategy.
First, lock down the top 60 anchor nodes six months prior to October. Provide these proven high-performers with dedicated PR support, corporate sponsorship matching pools, and priority technical assistance. Protecting the yield of the top 10% secures nearly half of the total revenue target before a single baseline yard sign goes into the ground.
Second, convert the remaining 565 homes from passive display hosts into active peer-to-peer recruiters. Distribute turnkey digital assets—pre-written neighborhood app posts, employer match request templates, and localized QR code graphics—in late September, forcing participating homeowners to secure their first $500 from their immediate social graphs before Halloween foot traffic even begins. By front-loading digital commitments and concentrating physical support on high-yield anchor nodes, the network insulates itself against October weather disruptions, local traffic ordinances, and micro-donor inflation.